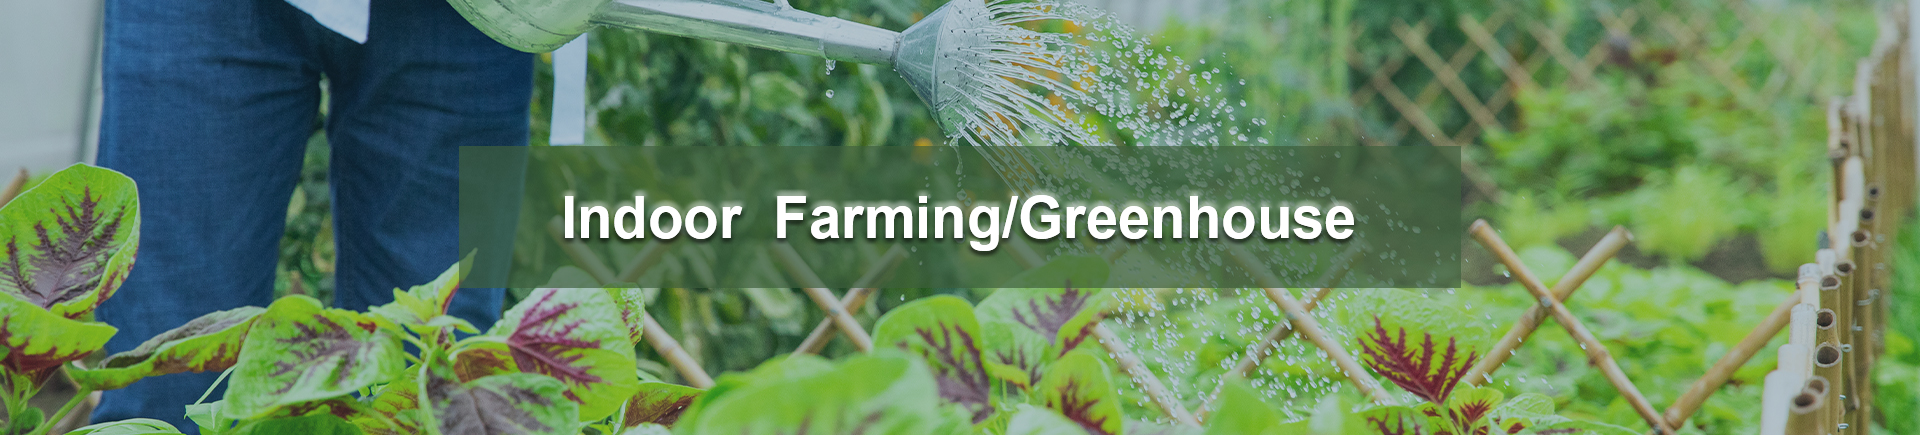
If you work in plant cultivation, greenhouses, or growing rooms, understanding VPD (vapor pressure difference) charts is essential. Let's explain it step by step in a clear, easy-to-understand, and practical way.
Low VPD = Humid air = Slow transpiration → Risk of mold growth and poor nutrient absorption.
High VPD = dry air = rapid transpiration → plants may dry out or be stressed.
Ideal VPD = Balanced water pull → Strong growth, efficient photosynthesis.
A typical VPD chart includes:
The X-axis (horizontal direction) represents temperature (in degrees Celsius or degrees Fahrenheit).
The Y-axis (vertical direction) represents relative humidity (RH %).
Colored areas or contour lines represent different VPD values (usually in kilopascals (kPa)).
Each point on the chart corresponds to a combination of temperature and humidity, thus yielding the VPD value.
growth stage
Ideal VPD range
(kPa)
Its meaning
Seedlings/clones
0.4 – 0.8
Maintain high humidity and moderate temperature to avoid stress response.
plant
0.8 – 1.2
Moderate transpiration promotes vigorous plant growth.
flowering
1.2 – 1.6
Dry air is beneficial to the development of resin and flower buds.
Tip: Many VPD charts use color coding—green indicates ideal, yellow indicates caution, and red indicates too high. Please refer to the recommended cannabis VPD chart .
Measure the temperature and relative humidity in the growing room.
Locate the point on the chart (the point where the two values intersect).
Read the VPD value for this region.
Adjustment conditions:
If VPD is too low, reduce the relative humidity or increase the temperature.
If VPD is too high, increase relative humidity or decrease temperature.
example:
Assume your growing room temperature is 28°C (82°F) and the relative humidity is 60%.
Find 28°C on the bottom coordinate axis.
Move vertically to 60%.
This point is probably around 1.1 kPa—perfect for plant growth.
1. The meaning of VPD


2. How to interpret VPD charts
3. VPD Zone Interpretation (Applicable to most plants, including cannabis and leafy green vegetables)
4. How to use it
 Hangzhou Hongtai Electrical Appliance Co., Ltd.
 info@seedmaxtech.com